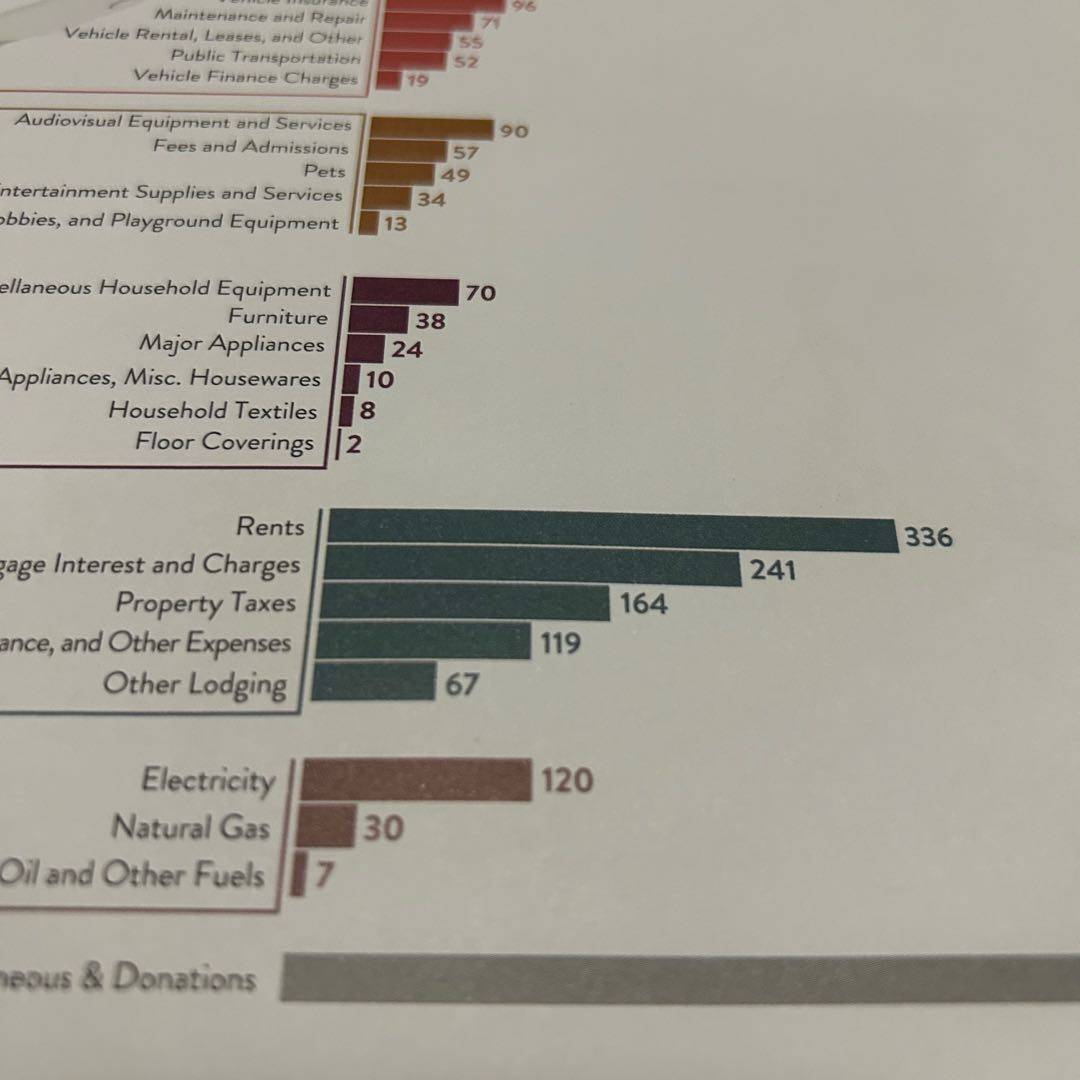


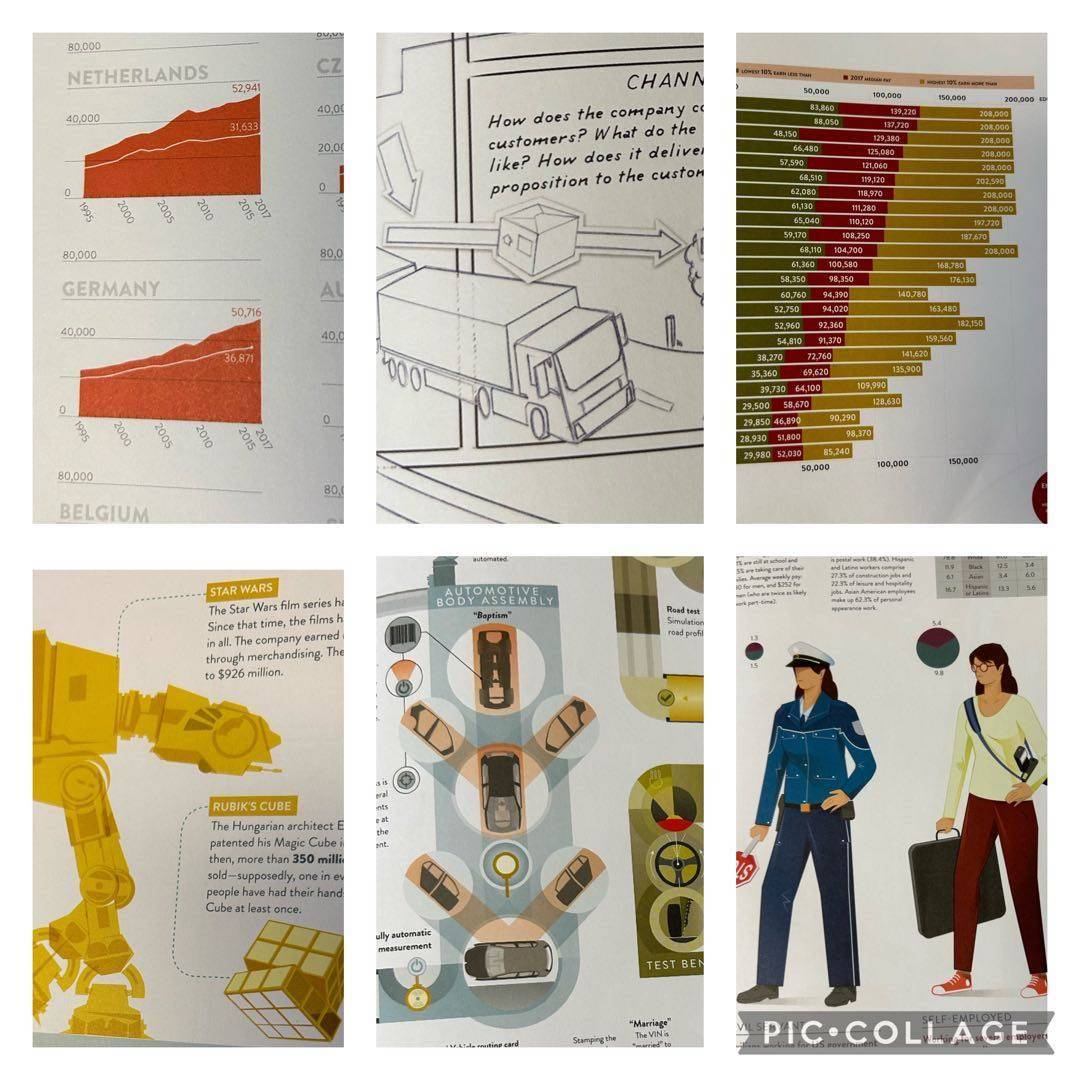
A fun collection of infographics taking a look at the global economy up to 2015. I loved the diversity of graphic types, from graphs to non-graph data viz to explanatory pages drawn like comics or blueprints. Most graphics were interesting and effective, with only a handful leaving me wondering if there was a better way to show the info. I was a little unsure of what country was represented when only one was spotlighted, though. #DataViz
20 likes